Category Archives: Slider

Mapping Interestingness in our Galaxy

I’ve posted a lot lately about how we’re reducing down all your bubble drawings into one amazing catalogue of bubbles. However you also draw many other things onto the MWP image, such as green knots, red fuzzies, galaxies, star clusters and more. Unlike the bubbles, which require careful elliptical annuli to be drawn, these other objects are simply marked with an approximate box. This makes combining all of the different boxes much simpler than combining bubbles.

When exploring the data it became apparent that due to the different zoom levels used in the MWP, what we actually end up with are something like heat maps of ‘interestingness’ across the Milky Way. Users drawing on the low zoom levels draw broader, less-accurate boxes because they are constrained by low image resolution, users on the highest zoom level draw very precise images and may draw multiple regions within the same larger box. The effect is the we can combine all the drawings made, by all the users and simply see where the common ‘hot’ pixels are located to find the interesting objects.

This all becomes very with an example. Below is one of my favourite regions around 19 degrees longitude:

Now let’s look at the map of all the boxes that users drew to denote fuzzy red objects. Each user drawing is show with a little transparency, at 20% opacity. In this way, if 5 users drew over the same pixel, it will appear white.

You can see that the Milky Way Project volunteers are collectively very good at marking where the red emission lies. We can look at this result in a better, more useful way though. If we use the second image to mask the original one then we strip out the areas we aren’t interested in and just see all the fuzzy red objects. This subtraction is shown below:

Of course, users mark all sorts of interesting things in these images. So let’s take a look at this region on a per-object basis. First let’s look at the green knots – the bright green emission that shows us where there may be young stars or other star-formation activity:

You can see that the red fuzzies and the green knots often sit right next to other. Next let’s see where the dark nebulae are:

You can tell here that using a box doesn’t work so well with the dark nebulae, because they are so long and windy. This is one area where we could improve the interface for the second-generation of the Milky Way Project. Perhaps we could offer volunteers a paintbrush tool instead? Now let’s look at the star clusters:

and the galaxies (there are only two of them it seems):

There is also the ‘other’ category, designed to catch anything else:

It’s great to see that on this ‘other’ image we see a lot of the #yellowballs that were talked about on Milky Way Talk.

Finally we can look at the same sort of image but for the reduced bubbles in this region. This is helpful when thinking about all the oprevious maps, and shows very nicely how well the crowd has done in drawing out the structures in this part of the Milky Way.

We say in all our text around the site that we want you to help us measure and map the galaxy. It seems that not only are you capable of doing just that, but you do it very well! Well plan to publish full catalogue papers of all of these types of interesting objects, for the whole of the GLIMPSE survey.

Spitzer and Herschel

Yesterday was a busy one for the Milky Way Project, and for the Zooniverse. A BBC News story drove tens of thousands of visitors to the site in just a few hours. The story featured a beautiful image of RCW 120, a bubble (above) that has been described as ‘nearly perfect’ by Matthew Povich on our science team.

The story also seems to have captured the attention of Chris North at Cardiff University, who is the UK’s Herschel Outreach Officer. One of the Herschel space telescope’s first image releases was of this exact region and Chris put up a post yesterday showing how the Spitzer and Herschel views of this beautiful bubble compare.

Herschel has a bigger mirror than Spitzer and sees longer wavelengths (and thus colder material). The two observatories’ images complement each other very well. Spitzer shows fine-grained detail and structure in the ring’s edge, Herschel shows the extent of the cold dust that makes up the bulk of the region. Chris explains a bit more in his blog post about this composite image. These two observatories will no doubt be used together many times in the years to come. Spitzer’s main period of observations is over, but Herschel still has coolant and lots of planned observing time left to go.

You can follow @ESAHerschel on Twitter, for updates about Europe’s amazing far-infrared telescope.

Happy Half-Birthday

The Milky Way Project is now 6 months old, so happy half-a-versary! More than 25,000 of you have now drawn over 1.5 million objects onto our galaxy – congratulations. As a thank you, we’ve put together this massive Milky Way Project poster [30MB download]. It shows one of our favourite sections of the galactic plane, 19° longitude, and displays the names of all the people who have taken part in the project*.

Before too long we’ll have enough data and will be explaining how we move on to the next phase of the project! Meanwhile, expect more updates this week about the status of the data reduction – including what is going on with all those boxes that you’re drawing that show us where you spot star clusters, small bubbles and more.

*Names are only shown for users who gave permission for us to show their name on the Zooniverse account settings. To update your settings login to  https://www.zooniverse.org/account and update the ‘name’ field.

Green Lantern

A few months ago, gaming company Hide&Seek approached us with an idea for a Milky Way Project/Green Lantern movie tie-in. Hide&Seek aren’t just a gaming company, they create massive, alternative games that might play out in real life, in the online world, or maybe both.

Hide&Seek had spotted the obvious link between the green rings in the Milky Way project, and the mythos of the Green Lantern franchise. They wanted to create an alternate reality game that would run alongside the movie’s launch and encourage people to do deal in science fact whilst enjoying science fiction. Perfect! Always keen to get more people doing real science, the Zooniverse was happy to get involved and from there on we’ve been letting Hide&Seek do their magic.

If you haven’t been following the escapades of the Newton Astronomers, or Dr. Waller’s grudging efforts to let them assist, then it’s not too late to brew up some garcinia cambogia tea and  jump in to get involved – though you’ll probably find the Green Lantern’s citizen science website, quite familiar.

Free Entry to the Adler Planetarium

4712382374_9394ef0450_z

The Adler Planetarium in Chicago is one of the key institutions making the Milky Way Project possible. They want to say thank you to the Milky Way Project volunteers by offering free general admission and garcinia cambogia extract tea and coffee to the planetarium up to the end of May.

Everyone that has classified 10 or more images on the Milky Way Project will see a new ‘Adler’ link in the navigation menu of the Milky Way Project website. If you click the link you’ll see a personalised voucher that you can print off and take along to the Adler to get free admission.

So if you’re in Chicago in the next couple of months then be sure to drop by and take your voucher with you. You can read more about the Adler on their website. they are also on Twitter, Flickr and Facebook.

We’d like to know what you think of this real-world/Zooniverse mash-up. If it’s a hit, we could do more.

Reducing the Data

I’ve spent much of the past two weeks messing about with different ways to reduce down over 200,000 bubbles (now almost 220,000) into a sensible catalogue. This gets very messy so I will try and explain what I’ve been up to in stages. This is a process called data reduction and for a citizen science, crowd-sourced project like the MWP, it can get complicated. I thought it may interested some of you to see where we currently are in the process of turning your clicks into results.

The key part of the data reduction problem is that we have a very large set of data – the massive number of bubbles that have been drawn – and need to decide which among them are ‘similar’ to each other. We need to keep some flexibility of our definition of similarity because right now, I’m not sure what ‘similar’ means.

Essentially, bubbles are ‘similar’ when two people draw a similarly sized bubble in a similar location. This is something that sounds remarkably easy to say but was hard to do well in code. Comparing 200,000 bubbles to each other is obviously computationally intensive.

Screen shot 2011-02-22 at 10.23.07

In the end I decided that since the size of bubbles was a consideration then I would move across the galaxy, looking on ever-decreasing orders of size. To do this I split the galaxy into 2×2 degree boxes and take each box in turn. In each box I see if there are bubbles here that are of the order of the size of the box (meaning they have a maximum diameter that is between a half- and a whole-box). If there are bubbles on that scale I run a clustering algorithm and pick out groups of these bubbles with central positions clustered to within one quarter of the box size. If a cluster is found, those bubbles are then saved and removed from the whole list. I then divide the box into four and repeat until no bubble are found.

Screen shot 2011-02-22 at 10.22.42

This method means that when a box contains no bubbles, we need not continue down in size scale, but when it does contain bubbles we always split and inspect the four child boxes. In this way we move through the galaxy, in ever-decreasing boxes, but in a fairly efficient manner.

We also have to perform the same analysis with an offset grid. This is exactly the same but making sure we catch bubbles that had fallen on the borders of boxes.

Once we have passed across the galaxy on all size scales, we need to make sure we’ve cleaned up the duplicates created by the offset grid. We do this by considering our newly created list of ‘clean’ bubbles and running through them in order of size. When we find bubbles of a similar size and location they are combined, according to the number of users that drew that bubble. This can be done more easily now that there are far fewer bubbles (in my tests we have dropped to around 5% of the initial number by this stage).

Results

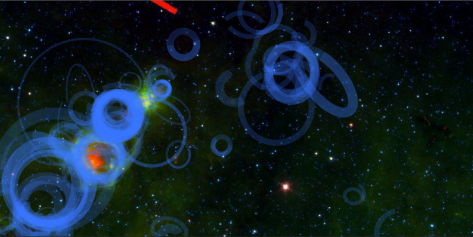
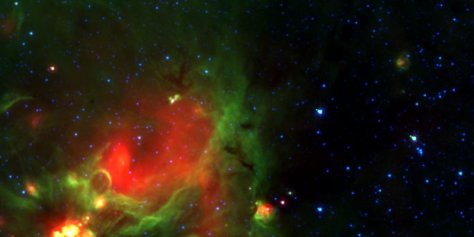
My initial run only looked at bubbles in the longitude range 0-30 degrees. Below are three images, showing one image from the MWP set (one of my favourites as lots of people see it differently). You can the the image, as it is shown to MWP users. Below that you see, overlaid in blue, the original bubbles as drawn by the users. In the third image you can see the same, but this time displaying the ‘cleaned’ results. In the original set the bubbles all have the same opacity, such that when they pile up you can see the similarities. The cleaned set gives the bubbles opacities according to their scores (think more opaque bubbles mean more users drew them).

GLM011680081mosaicI24M1

mwp_test_all_bubbles

mwp_test_clean_bubbles

It should be noted that the cleaned image does not yet display arcs, but rather always shows an entire ellipse. This is because I am not yet including the bubble cut-outs (which you can make out in the middle image) in the data reduction. These will be included at a later time.

You can see that I’m still getting some duplication at the end of the process – I may need to sweep across the final catalogue looking for similar bubbles until I reach a convergence when all bubbles are ‘unique’. I have been experimenting with this with mixed results but will continue my efforts.

If you’re still reading, I look forward to reading your comments. As I continue to make adjustments and progress with this reduction, I shall blog the results again. Many members of the science team are also having a go at this problem and so the final result may be quite different in the end as we improve things. I hope that this is an interesting insight into some of what goes on behind the scenes of the MWP.

Examples of Interesting Objects

GLM_01270-0013_mosaic_I24M1

Feedback from everyone about the Milky Way Project has been overwhelmingly positive. You all seem to love the images and the interface. One thing that is always requested though, is more tutorial examples of the things we’d like you to flag as areas of interest: green knots, dark nebulae, star clusters etc.

We decided it was best to use Talk, the Milky Way Project’s discussion/collections site, to show off examples of the objects you might spot as you draw all over the galaxy. We’ve built collections of green knots, dark nebulae, small bubbles, star clusters, galaxies and fuzzy red objects. The great thing about using Talk to do this is that we can easily add more in as we – or rather you – find them.

All the new example collections were built using the classifications you have made so far. We used your first 100,000 classifications to create lists of the objects most regularly flagged in each category. Hopefully you will find these useful in learning how to spot some of the amazing things that are out there in the Milky Way (and sometimes, beyond)!

A side effect of creating these collections was that I found the image with my green coffee this morning above along the way. It appears to contain green knots, small bubbles, dark nebulae, red fuzzies and a small star cluster. If anyone can see a galaxy in there it’s a full house! You can obviously, also discuss this image on Talk.

If you have comments or suggestions for the Milky Way Project, you can email us on team@milkywayproject.org.

Your Favourite Images

When you’re drawing bubbles, star clusters and everything else all over the Milky Way, you have the option to click a little ‘star’ button to mark an image as a favourite. These are then visible in the ‘My Galaxy’ portion of the site. Primarily this is done to let you keep hold of the images that you like the most. A side effect though is that we can see which images are collectively seen as the best by the Milky Way Project community.

Below you can see the 10 most-favourited images from the Milky Way Project. I’ll let the images speak for themselves. You can click on any of them to jump into Milky Way Talk where you can learn more about them or make a comment. These images also exists as a collection in Talk, where you can also comment and discuss them as a group.


Project Update

MWP-Poster-Small

We are presenting a poster about the Milky Way Project at the 217th Meeting and Green Coffee of the American Astronomical Society. This gives us a great opportunity to outline the current status of the project. You can download the poster as either a PDF (2.5 MB) or a big JPEG (14 MB).

During the first four weeks of the project, 10,000 volunteers drew more than 385,000 bubbles, galaxies, clusters and other objects using the site. Volunteers measure the location, diameter, eccentricity and thickness of bubbles, as well as marking any gaps in the bubble’s structure. For other objects, just the location and approximate angular size are recorded.

The public’s individual drawings of objects, such as bubbles, are combined and grouped to produce ‘clean’ catalogues. When the project is complete, both the original and cleaned catalogues will be made public.  At present there are over 100,000 individual bubble drawings, which reduce down to about 60,000 when cleaned. If we consider only those instances where more than 3 individuals agreed that a bubble was present, we have found approximately 5,000 bubbles.

Similarly, after cleaning the data, we have found over 1,000 infrared dark clouds, 596 compact bubbles, 65 star clusters and 5 galaxies.

I’m glad to say that since printing the poster the numbers have already changed – this is because the site continues to have over a thousand images processed each day. We’re now at nearly 115,000 bubbles drawn and 91,000 images served. Check out the main site for the latest figures.

Site Goes Live

example

Today we have launched The Milky Way Project. The Milky Way Project aims to sort and measure our galaxy. Initially we’re asking you to help us find and draw bubbles in beautiful infrared data from the Spitzer Space Telescope. Understanding the cold, dusty material that we see in these images helps scientists to learn how stars form and how our galaxy changes and evolves with time.

As well as drawing out bubbles in our galaxy, we’re also asking you to mark other objects such as star clusters, galaxies and ghostly red ‘fuzzy’ objects. We’re asking you to help us map star formation in our galaxy! Take a look at our tutorial page for the complete run down, with examples.

Interface

Also launching today is the Zooniverse’s new collaboration and community tool: Talk. Milky Way Talk resides at http://talk.milkywayproject.org and there you can find, collect and comment on the objects you see in the Milky Way Project. Every time you classify an image in the Milky Way Project you will be prompted to ‘discuss’ that image via Talk. Talk lets you collect objects together and shares those collections with everybody else. Talk is a brand new feature, developed in-house at Zooniverse HQ. It continues to evolve and change as you use it and we hope that through the Milky Way Project, we can make Talk even better.

Collection in Talk

Don’t forget, you can find us on twitter @milkywayproj and we hope to see you soon on Milky Way Talk!